
Workforce data, ready for decisions
Dashboards, work trends and the report builder answer most questions inside BeeWorkforce. When you need the data elsewhere, export it or receive events by webhook.
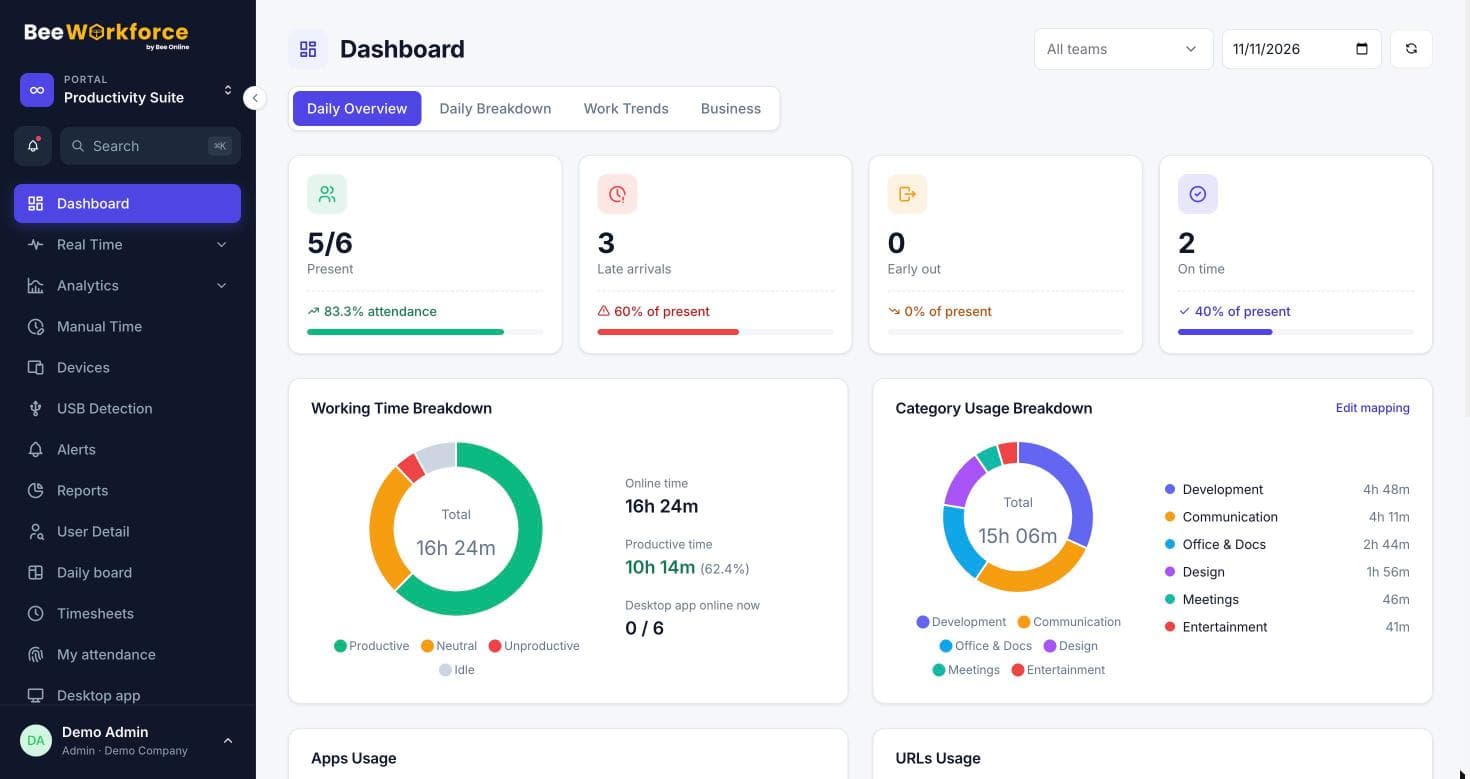
Dashboards
Daily overview, breakdown, work trends and business views.
Exports
CSV exports from every report and analytics page.
Webhooks
Signed events such as alerts and leave requests sent to your systems.
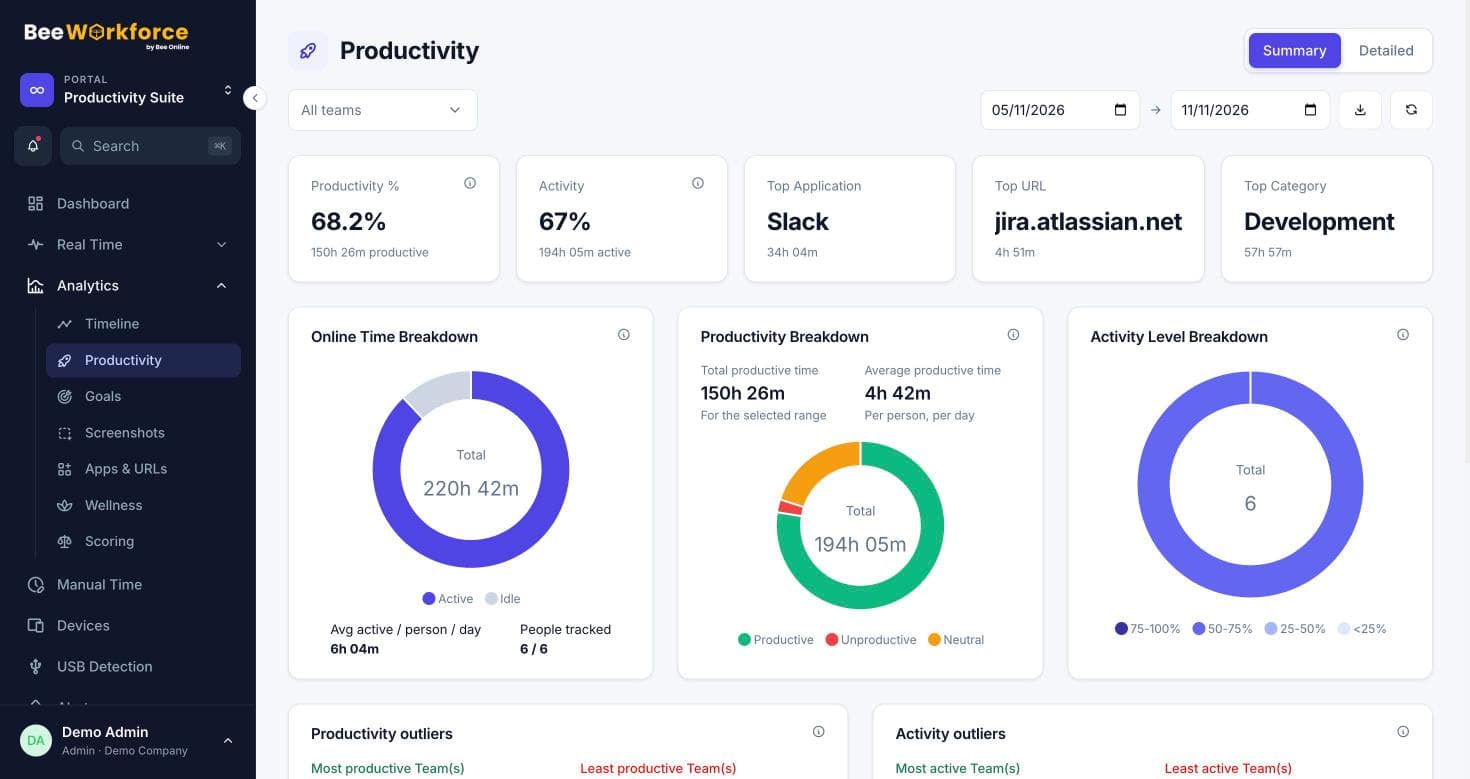
Trends across the business
See how attendance, online time and productivity move over weeks and months, and compare teams side by side.
- Work trends over time
- Teams insight report
- Range filters
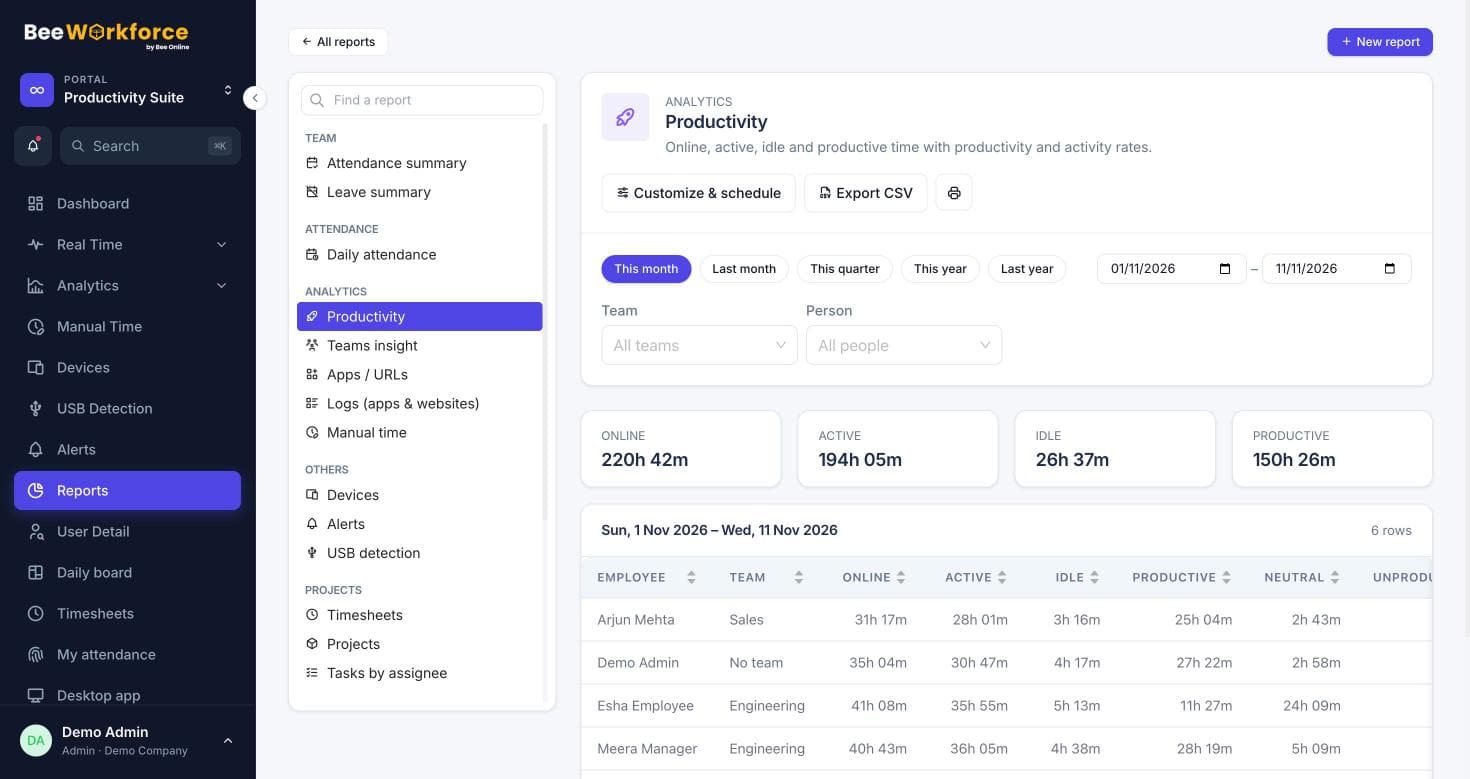
Take the data with you
Build a report with the exact columns you need and schedule it as a CSV. There are no direct BI-tool connectors yet; CSV and webhooks are the way in today.
- Report builder
- Scheduled CSV emails
- Webhook events
How teams use business intelligence
- Board-level workforce summaries
- Feed a spreadsheet model with weekly data
- Compare teams and locations
- Track utilisation over quarters
Frequently asked questions
Do you connect to Power BI or Tableau?
Not directly yet. Use scheduled CSV exports or webhooks to bring data into your BI tool.
Can I build custom dashboards?
You can build custom reports with your own columns and conditions; dashboards are built in.
Is there an API?
Webhooks send events today. Contact us if you need specific data access.
See BeeWorkforce with your own team
Book a 30-minute walkthrough. We'll set it up around how your team works and answer your questions.