
Productivity you can explain
Productivity comes from the apps and websites people use and your own rules for what counts as productive, so every number has a clear reason behind it.
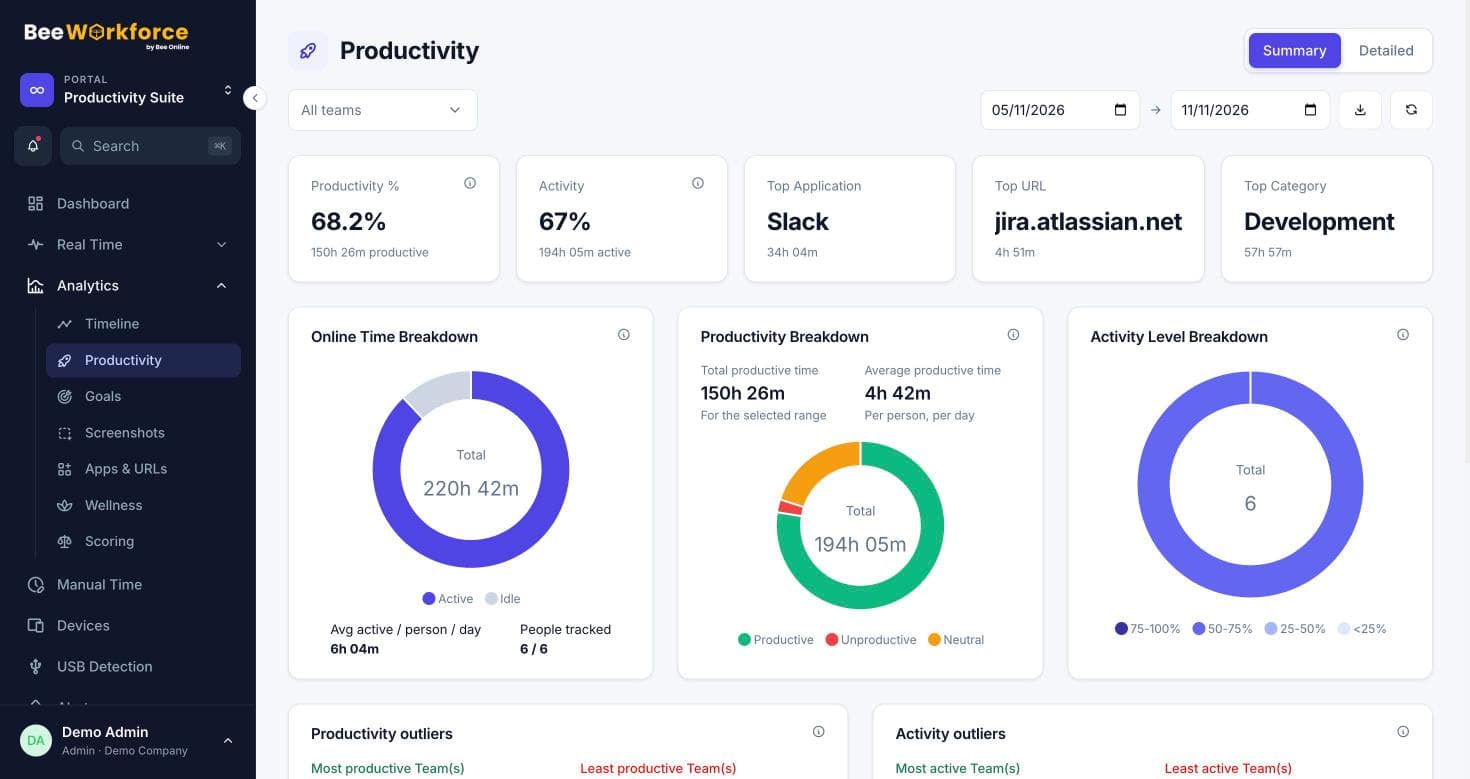
Productivity rate
Productive time as a share of online time, per person, team and day.
Activity rate
How much of the online time had keyboard or mouse activity.
Trends
Daily and weekly trends show whether things are improving.
Summary and detail
The summary shows totals, top apps and websites and team comparisons. The detailed view lists each person with online, active, idle and productive time.
- Team and person views
- Top app and website
- Averages per person per day
Fair rules per team
Classify apps and websites once, then adjust them for teams with different work. A score combining productivity, activity, punctuality and goals is available too.
- Productivity categories
- Team overrides
- Weighted scoring leaderboard
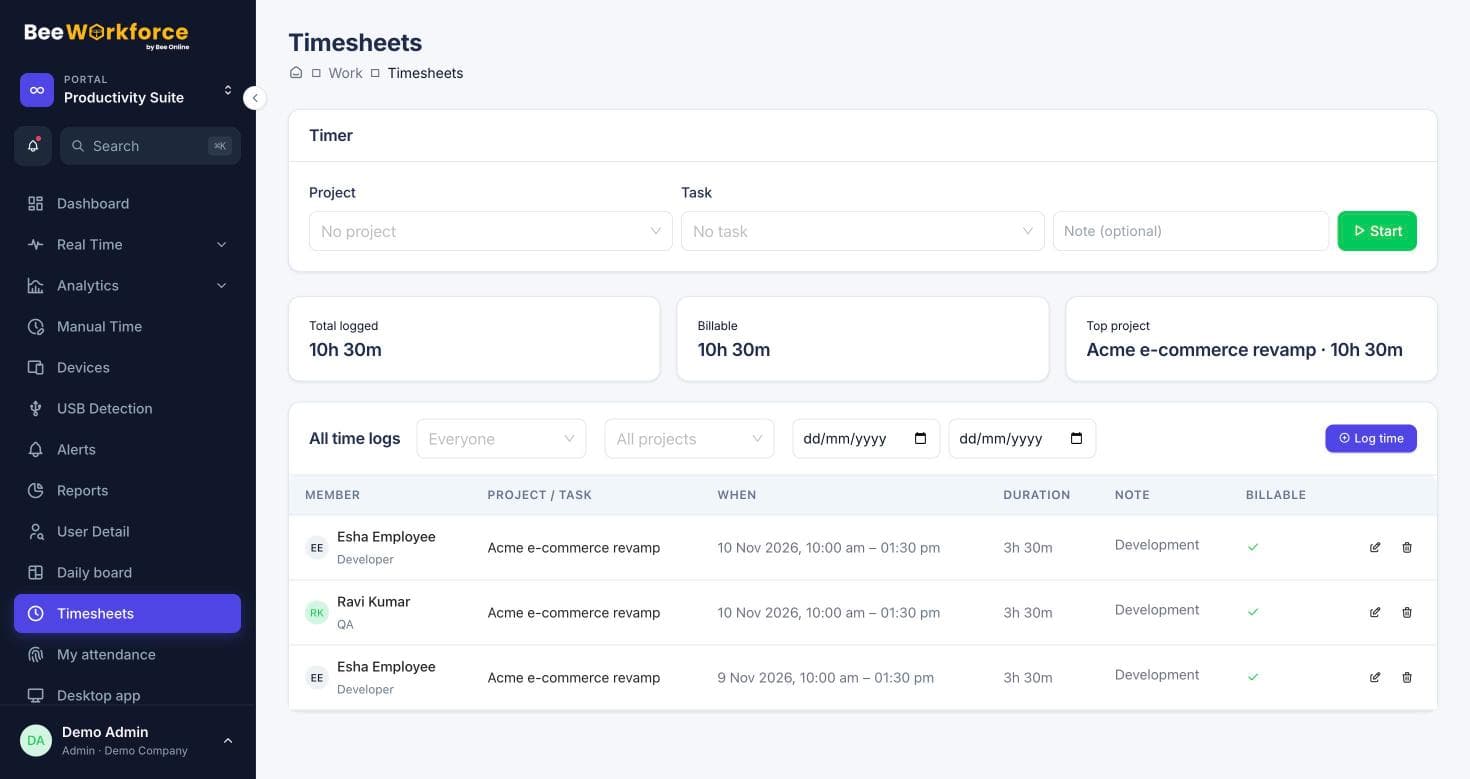
How teams use productivity tracking
- Compare productivity across teams
- Coach people with clear, shared numbers
- Track the effect of process changes
- Spot distractions before they become habits
Frequently asked questions
How is productivity calculated?
Productive minutes divided by online minutes. Productive minutes come from apps and websites in categories you mark productive.
Can employees see their score?
Yes. Employees see their own productivity on their dashboard.
What about time away from the computer?
Meetings and calls can be added as manual time, with the productivity attribution the person chooses and a manager approves.
See BeeWorkforce with your own team
Book a 30-minute walkthrough. We'll set it up around how your team works and answer your questions.