
Decisions based on how work actually happens
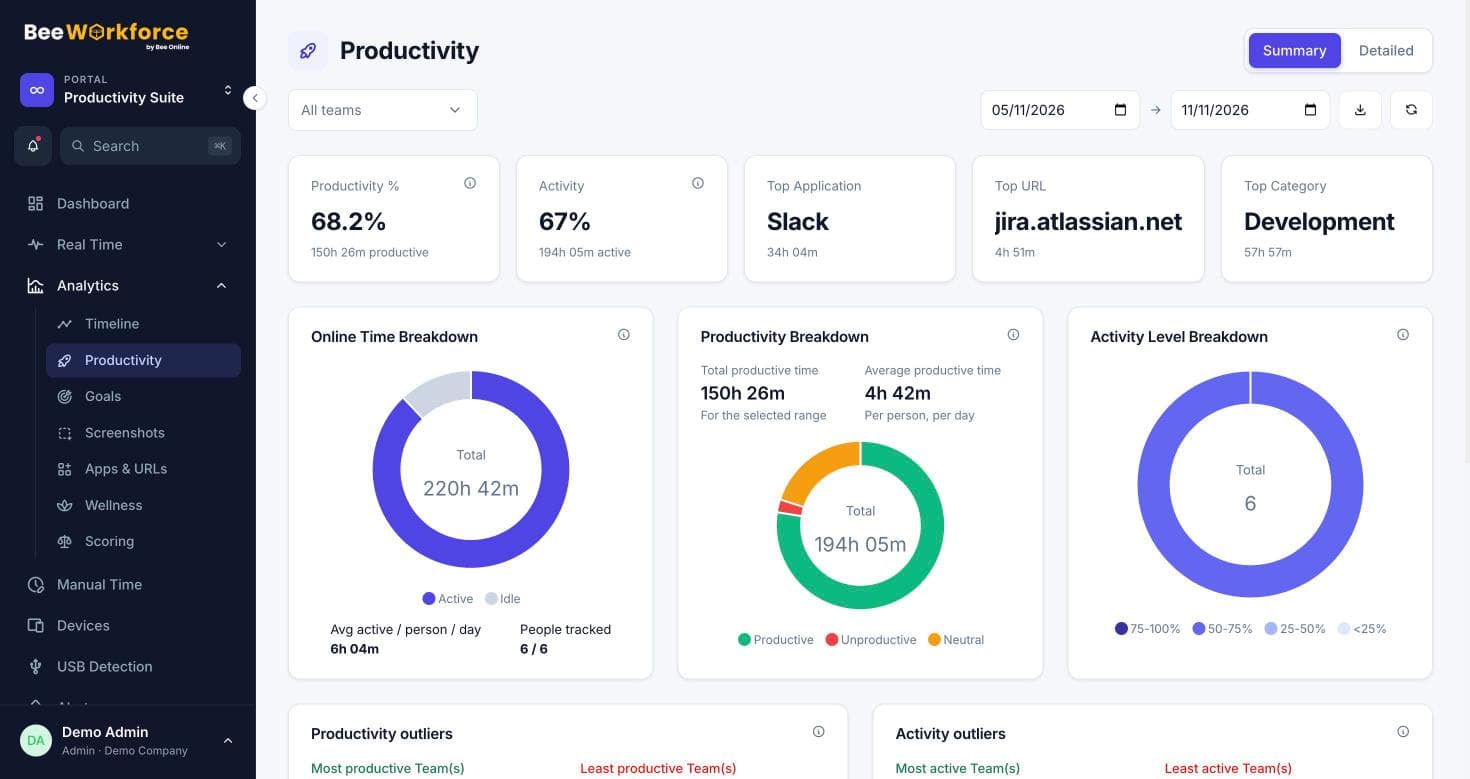
Productivity, goals, wellness and trends by person, team and period, plus reports built to your own columns.
What gets in the way
Gut-feel decisions
Staffing and process changes are made without data on how time is spent.
Spreadsheet reporting
Monthly reports take days of copying and pasting.
Problems seen too late
Disengagement and overwork show up only when someone leaves.
Productive time, by your own definitions
Classify apps and websites as productive, neutral or unproductive, with different rules per team. Productivity and activity rates follow automatically.
- Per-team classification rules
- Daily, weekly and monthly trends
- Goals with targets per day
Reports that fit your questions
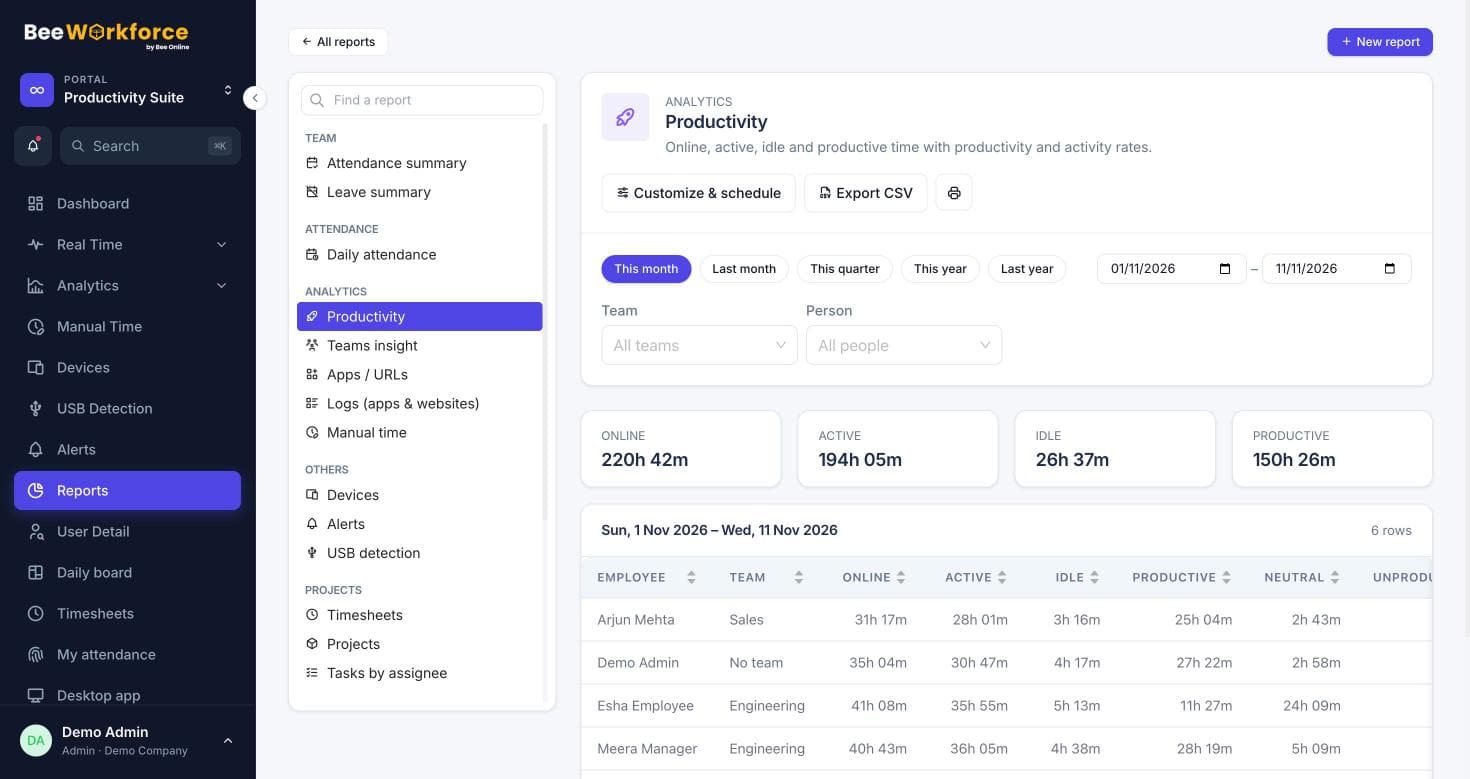
Start from any report, choose columns, add conditions like productivity under 60%, sort, save and share. Email it on a schedule as CSV.
- Report builder with live preview
- Shared reports respect each viewer's access
- Scheduled CSV emails
Features that help
Productivity tracking
Productive, neutral and unproductive time, with productivity and activity rates.
Goals
Daily targets for online, active and productive time, with who met them.
Wellness
See who is overworked or underused against limits you set.
Reports
Ready-made reports, your own report builder, and scheduled CSV emails.
ROI and productivity trends
See how productivity and working time change week by week.
Technology usage
Which apps, websites and computers your teams actually use.
Frequently asked questions
Can managers see only their own teams?
Yes. Managers see their teams, admins see everyone, and employees see themselves.
Can we export the data to our BI tool?
Yes. Export any report to CSV or schedule it by email; direct BI connectors are planned.
How is productivity calculated?
From the time spent in apps and websites you classify as productive, compared with online time.
See BeeWorkforce with your own team
Book a 30-minute walkthrough. We'll set it up around how your team works and answer your questions.